

A comprehensive inflation shock
Economic history is often replete with examples of present-day events. The inflation shock that hit the world in waves from early 2021 is clearly one of those events for which we seek an historic precedent. The global increase in inflation has been breath taking. Even the June 2022 month-on-month inflation readings remained high in an historic context (see chart). July US inflation readings contained the first seeds of a loss in momentum – US PPI inflation (year-on-year) dropped by more than three percentage points; CPI inflation was negative month-on-month.
US producer inflation peaked above 20% in year-on-year terms (consumer inflation, above 9%) in June; in South Africa (SA), producer inflation exceeded 17% (consumer inflation, 7.4%). These inflation readings are shocking in the Great Moderation era and in the post-GFC world with inherent disinflationary tendencies. However, they are not unprecedented. The 1970s and early 1980s produced similar readings following the oil price shocks of 1973 and 1979 (see the charts).
During both periods – then and now – the monetary authorities had to battle the recessionary impact of the cost-raising supply shocks. The contemporary pandemic supply shock was arguably more profound.
Spot the difference with the 1970s and early-1980s inflation
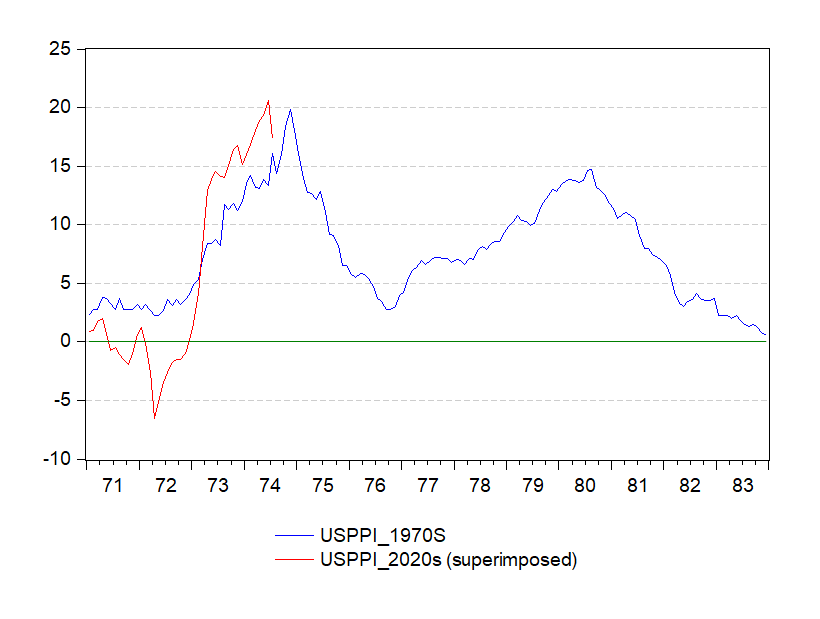
While some analysts are quick to highlight the similarities over these two periods, in the current conditions, it is critical to focus on the differences if we want to get close to evaluating the short to medium-term inflation prospects and risks. Historic precedent is usually a handy guide but can be misleading exactly where it matters.
Both periods witnessed a vicious cost-push inflation shock; both periods witnessed expansionary macro-economic policies, with the authorities fighting the recessionary forces unleashed by the cost-raising supply shocks. Then it was oil and the post-war belief in Keynesian economic stimulus. Currently we are dealing with the consequences of the COVID-19 pandemic (supply chain disruptions and shifts in consumption patterns), the food & energy price shocks tied to the Russian-Ukraine war and – it would appear – the demand-pull effects of (over-) stimulatory macro-economic policies.
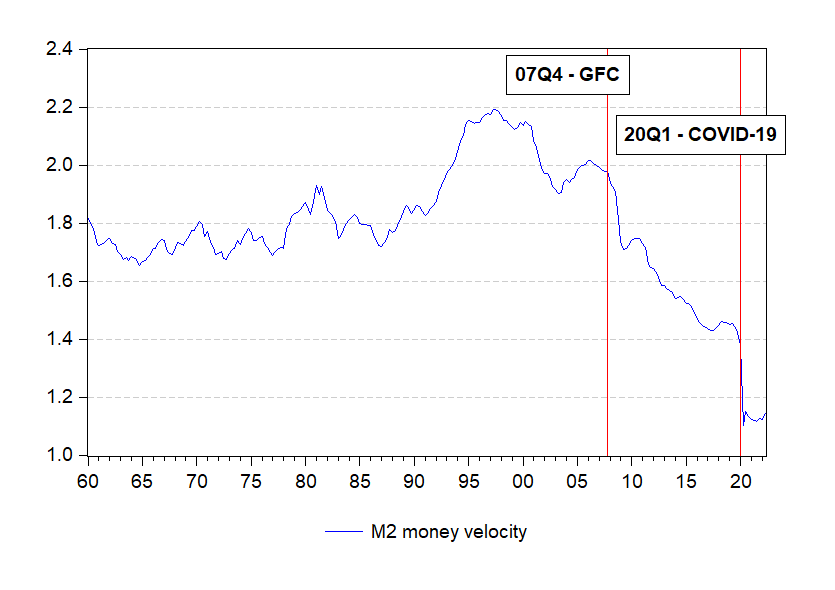
Spot the difference. The 1970s was a case where the post-war belief in Keynesian economic stimulus was taken too far with fiscal deficit financing, which was monetised by the monetary authorities of the day. This is not part of the contemporary monetary policy frameworks of most central banks that have engaged in Quantitative Easing (QE) and – more recently – Quantitative Tightening (QT). Elsewhere in this blog the technical differences between the macroeconomic impacts of the monetisation of government deficit finance and QE were explained. In the 1970s the expansion of the money supply accelerated on a permanent basis; with QE the expansion is temporary plus the velocity of money is currently at record low levels, also compared to the 1970s (see chart). The latter counters the demand-pull effects of monetary expansion and is an important factor why inflation remained lower than expected in the years following the GFC.
In the aftermath of the GFC, the velocity of money nose-dived as the financial innovation leading up to the sub-prime financial crisis ended abruptly, to be succeeded later by the stringent conditions of Basel III (see chart). Velocity of money tends to react to changes in the financial architecture and/or the direction of financial leverage. These tendencies prevented the macro-economic stimulus at the time of the Great Recession spilling over into higher inflation – actual inflation continued to surprise on the low side in the decade following the GFC.
Similar patterns were repeated with the COVID-19 pandemic impact and the inflation tsunami that has been unleashed in 2021/22. However, this time the GDP demand/output shock was unprecedented. At the time of writing, the world was still suffering the reverberations. Yes, the macro-economic stimulus packages were Herculean, but so was the output gaps in the wake of national economic lockdowns.
Many economists argue (with the added benefit of hindsight) that the stimulus was overdone and primarily responsible for the current inflation surge. Some go as far as suggesting no difference with the 1970s monetisation of deficit financing by the government. These analysts foresee similar medicine curing inflation now as was administered by the then Fed Chairman, Paul Volcker (early-1980s). The key point is that inflation was accommodated in the 1970s, it is not the same this time around. Yes, the shock was larger than expected and the macro-economic stimulus may have been somewhat overdone (including the delay in raising interest rates), but fundamentally the approach to disinflation is qualitatively different.
The medium-term outlook is different, albeit risky
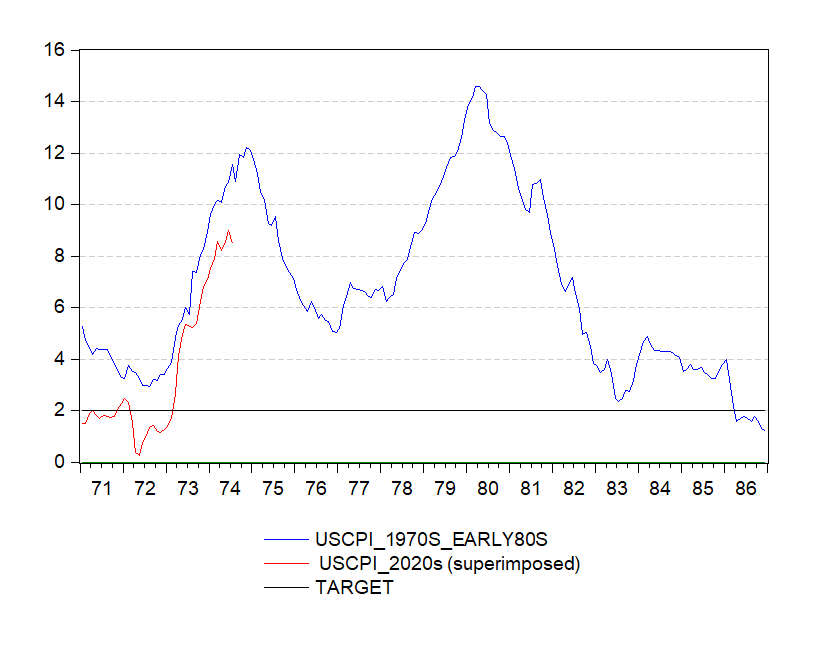
The larger weight one accords to the once-off pandemic-induced cost-raising factors (boosted by Russia’s invasion of Ukraine and its impact on energy and food prices) as the primary source of the inflation tsunami, one soon understands that it is unlikely that inflation will become entrenched and that not too much interest rate tightening will be required in containing inflation. Current medium-term inflation expectations have been on a different trajectory compared to the 1970s – inflation is unlikely to become entrenched (see chart) [1].
As soon as the once-off cost-raising factors begin to fade, the modest interest rate increases impact demand and inflation expectations, chances are that inflation will soon (in 12 to 18 months?) subside closer to target levels (2% in the US). Add to that, the disinflationary mega trends of our age, residing in demographics; high inequality and low productivity; growth constraints tide to climate change and its associated disasters, etc., as well as the war-induced global economic slowdown underway, it is not far-fetched to note the possibility of a return to deflationary tendencies in the not-too-distant future.

Therefore, we may be close to the end of the tightening phase of monetary policy. The Fed and other central banks are walking a treacherous tight rope; however, in their inflation-fighting armour they do have the option of QT should monetary conditions remain too loose for comfort, or in case renewed demand pressures threaten the prolonging of the current living cost crisis (not to mention any potential flare-ups over the medium-term). A very different outlook compared to what transpired in the 1970s and early-1980s. The key risk would be if the Fed (and other central banks) do not heed the rationale of QE (originally) and the imperative to follow-through with QT. This would change the medium-term outlook and then the resemblance with the 1970s is likely to gain traction.
[1] Unfortunately, the available data only goes back to 1982. US CPI inflation peaked in April 1980 at 14.6%. Early 1982 it had receded to 6-7%. Please note that the Fed does not officially target a 2% CPI inflation rate; it has an informal target around 2% for the PCE price deflator.
[2] The sources of data in this note are: St. Louis Federal Reserve (FRED data base) / Statistics SA
“When you adopt a cyclical worldview, your outlook will be in the minority whenever the chance of an economic turning point is high”
Achuthan & Banerj