
Some background
Much has been written on the ‘commodity price cycle’. Whereas the range of commodities varies from food to energy to hard and other soft commodities, the commodity cycle is usually considered by tracking commodity prices excluding food and energy and other soft commodity prices. While each individual commodity has unique drivers, when the trajectories of (metal) commodity prices are compared over the long-term, the degree of synchronicity is quite remarkable.

Particularly in the case of metal commodities, a clear clustering of turning points is evident from time to time (also see Arango; Arias & Florez, 2012: Trends, Fluctuations & Determinants of Commodity Prices). Hence the practise to combine the price of individual commodities into a composite price index.
As the focus is on the SA economy, the chosen (real) commodity reference cycle is a weighted seasonally adjusted US$ index of SA’s five most important export commodities, i.e. gold, platinum, coal, iron ore and copper, deflated by an USA manufacturing export price index.[1]
Research has shown that to the extent that a global business cycle can by identified – typically the G7 industrial production cycle – it is a (relatively weak) driver of global commodity prices. From 2000, China’s industrial production had a more significant impact.
A stronger link has been identified with the global capital flow cycle, in turn linked to US real interest rates, particularly over the long-term – see Reinhart et al., 2016[2]. The authors find a close long-term relationship between peaks and troughs in the global capital flow cycle and the commodity price (super) cycle. It follows that one should distinguish between the short-term and the long-term when assessing the link between commodity prices and capital flows (or even the global business cycle).
Global recessionary periods & commodity prices
The G7 countries industrial production cycle broadly agrees with the cyclical pattern in industrial production of SA’s most important trading partner economies – see the chart. This is explained by the fact that the EU, USA & Japan happen to be important SA trading partner economies.
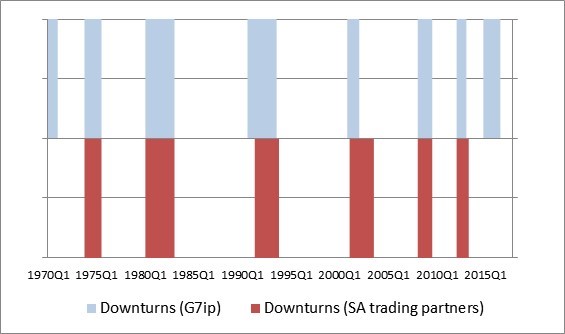
There appears to have been only a number of global recessionary periods from 1970 to 2021, i.e. the mid-1970s (oil price shocks), the deep early-1980s downturn (2nd oil price shock and 3rd world debt crisis), the early 1990s (Japan’s fall from grace and German reconstruction), the early-2000s (bursting of the dot.com bubble), the Great Recession (2008-09) and its 2nd leg in the Euro area (2012-13), and in 2020 the COVID-19 pandemic-induced plunge in global economic activity.
Apart from these recessionary periods, the G7 countries industrial production cycle also registered downturns during the early-1970s and 2015-16. The latter downturn occurred in the aftermath of the Great Recession impact during a time when global growth was weak and unsynchronised. Falling/low commodity prices caused severe pressures in commodity exporting developing economies in 2015-16 and therefore global growth.
Regarding the commodity price cycle, considered over the 50-year period from the 1970s, the first chart above shows the trend in the composite real commodity price index, with two peaks – the first in 1980Q1 and the second, 2011Q4.
The first long-term upcycle may be traced back to the 1970s oil price shocks, low interest rates and high inflation. The two oil price shocks (1973 and 1979) increased the production cost of commodities, which contributed to the increase in commodity prices. Furthermore, low real interest rates increased the supply of commodities, reduced the demand for storage (commodity stocking) and stimulated speculative investment into commodities, raising its demand. These forces peaked early-1980. Thereafter a long down cycle is evident as US real interest rates increased (sparked by the positive real interest rate monetary policy of Paul Volcker in the US), the relative commodity intensity of production declined and global trend growth tapered off.
The second long-term upcycle commenced around 2000. This was later identified as a commodity super-cycle. An obvious driver has been the sustained high commodity-intensive demand from China (entering the WTO in 2001, with growth in that economy exploding to double-digit levels). However, one should not underestimate the role of the decline in US real interest rates – see below.
The commodity super cycle was briefly interrupted by the 2008-09 GFC; however, sustained and countervailing growth in China drove a rebound and the peak only formed at the end of 2011 when the Chinese growth performance cooled down as the policy authorities engineered a re-balancing of the economy.
Following the super cycle over the 2000s, commodity prices have troughed again towards the end of 2017. The upturn in commodity prices was moderate initially, with a (weak) recovery in global growth led by the US and developed economies being the main driver. This improvement in commodity prices was later boosted in the wake of the pandemic impact owing to supply chain bottlenecks emerging as lockdown measures disrupted standard logistics. The impact of this factor has been huge and underestimated; however, is expected to wear off during the course of 2022. The other important support for commodity prices remains the relatively low level of US interest rates – see below. In all, the relationship between variations in international commodity prices and the G7 countries’ industrial production cycle is not so clear – see chart.

G7 industrial production business cycle phases vs a real commodity price cycle
Global capital flows, interest rates & commodity prices
In their analysis of global capital flows, Reinhart et al. identify a long upturn in capital flows (expressed as a ratio of USA GDP) in the post-war period, i.e. from 1946 to 1981. The 1950s and 1960s were characterized by financial repression and global capital flows were weak; however, this changed from the early-1970s with the collapse of the Bretton-Woods system of fixed exchange rates. While an ensuing trough is identified in 1986, the upturn in capital flows between 1986 and 1991 was less than robust and the downturn lasted until 1999, where-after a protracted upturn followed and which peaked in 2011-12 (actually, early-2013 with the so-called Fed taper-tantrum).

The interesting part of this pattern is that it broadly coincides with the global non-oil real commodity price (super) cycle described above. The latter reached a peak in 1980 and as can be seen from the accompanying chart, and ignoring the flat upturn between 1993-95, this downturn phase only bottomed in 1999. Thereafter, and excluding the brief and sharp fall in commodity prices during 2008 (in response to the global financial crisis), a strong upturn followed, which lasted until 2011, i.e. the peak of the so-called commodity super cycle. Commodity prices collapsed between 2011-15, with some improvement ensuing from 2016/17, later to be boosted by the raw material shortages in the wake of COVID-19 induced economic lockdowns.
Therefore, absenting from the pandemic disruption, the inverse relation between the commodity price cycle and the real US short-term interest rates (driving the international capital flow cycle) is clear. The correlation coefficient is -0.46. The inverse relationship between the movement in US real short-term interest rates and commodity prices is evident for all the metal commodity prices tracked, i.e. gold, coal, copper, iron ore and platinum prices, particularly over the early-1980s to end-2011 period; thereafter the inverse relationship is not as consistent between the various commodities. The inverse relation remained in place, with the rising tendency in real interest rates (mainly due to falling inflation), in the case of the platinum and coal prices; not so in the case of the iron ore, gold or copper prices.
The non-oil commodity cycle exerts a strong influence on the longer-term development of the SA business cycle.
Conclusion
The phases of the commodity super-cycle have been identified: a long upturn peaking in 1980 (in line with the 1981 peak in global capital flows), followed by a long downturn between 1980-81 and 1999 (in line with the trough in the global capital flow cycle) and followed by a protracted upturn peaking in 2011 (again in line with the global capital flow cycle as identified by Reinhart et al.). The COVID-19 induced peak in commodity prices was driven by exceptional factors and the commodity upturn is expected to continue petering out, also as the US Fed commences with the normalization of monetary policy. To the extent the US interest rates remain relatively low, it will remain a supportive factor for metal commodity prices.
In all, the relationship between the commodity price cycle and G7 industrial production is less clear, particularly during the 1980s and 1990s, whereas the inverse relation with real US short-term interest rates (read: monetary policy) appears to be more enduring. It is also true that Chinese industrial demand has played an important part in the variation in metal commodity prices from the year 2000.
References
[1] The sales of these commodities account for more than 80% of SA’s aggregate mineral export sales.
[2] Reinhart, CM, Reinhart, VR & Trebesch, C. 2016: Global cycles: capital flows, commodities and sovereign defaults, 1815-2015. American Economic Review: Papers & Proceedings, 106(5): 574-580