
Some background
As a share of national GDP, manufacturing real value-added peaked during the early 1980s. Whereas SA’s industrialization commenced during the 1920s and 1930s, based on agriculture and mining activity, its industrial growth really got going following WWII. This is also the time when most of today’s emerging market economies’ industrial development commenced (see Simandan, 2009). Initially – and more so during the 1970s and 1980s – the development of SA’s manufacturing sector relied on inward-looking industrial policies (mainly tariff protection, but also quantitative measures such as import controls); during the late 1980s and in response to trade sanctions, an outward-looking strategy was adopted (McCarthy, 2015).
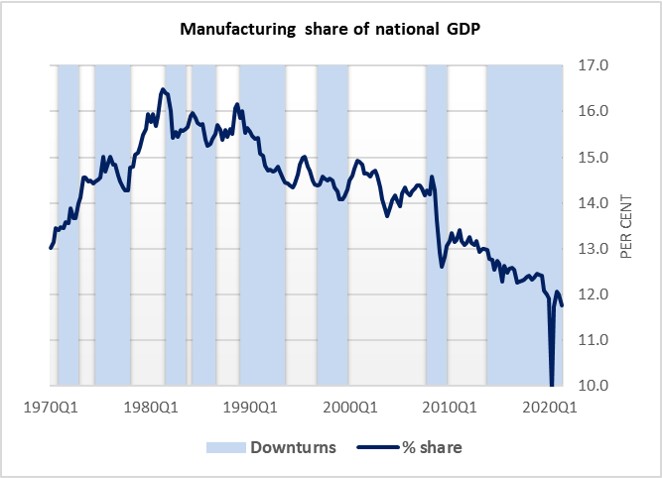

SA witnessed strong manufacturing growth during the 1950s, 1960s and 1970s as imports were being replaced – the real share of GDP peaked in 1981 (around 16.5%); however, since then it has been in relative decline as the SA economy became more services-oriented (chart, left). Whilst the declining share of manufacturing is a normal phenomenon in developing economies that diversify to services (which reduces the relative demand for manufactured goods in favour of services), in SA’s case there was also a measure of ‘de-industrialisation’ in place, i.e. the outright destruction of production (and export) capacity due to competitive issues, particularly in the aftermath of the Great Recession in 2009 (chart, right). It is evident from this chart that SA is increasingly failing to produce the goods it consumes. This growth period in the economy also coincided with the dramatic retrogression in political governance under the former President, Mr. Zuma.
From being industrialised behind high tariff walls, the local industry suffered major adjustment problems when SA joined the GATT in the early 1990s (with a rather generous tariff offer). This may have contributed to the relative decline of manufacturing in the domestic economy. However, the shocking relative decline following the precipitous Great Recession impact also points to adverse domestic factors constraining the sector’s growth: the labour dispensation (characterized by labour market instability and above-inflation and productivity growth nominal and real wage growth respectively), infrastructure bottlenecks and costs, e.g. electricity supply, communication, rail and harbour bottlenecks, economic policy uncertainty, etc. all contributed to the competitive decline of the sector – exports hardly responded to the global economic upturn from the middle of 2016.
This brief background places the historical evolution of the sector in SA in some context. Despite its relative decline, manufacturing activity accounted for close to 12% of the national GDP in 2021, which makes it a large and important sector. Apart from its sizable direct influence, the factor which multiplies its cyclical influence on the economy is related to the sector’s wide linkages with other sectors of the economy – see the accompanying diagram.
Manufacturing’s wide linkages with other sectors in the economy
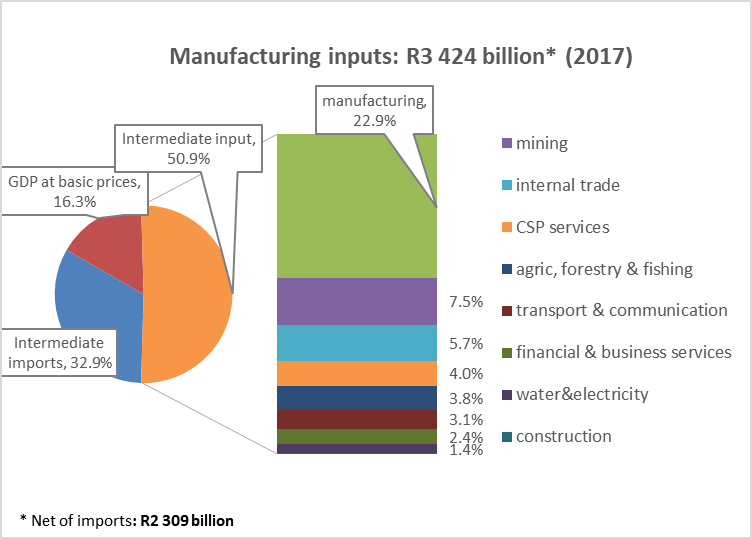
In 2017 total output sales amounted to no less than R2.154 trillion, this is more than one-fifth of all economic activity in SA. The sector plays a critical role in the evolution of SA’s business cycle and this is despite its relative decline. It is probably the key sector driving the SA business cycle. From a value-added perspective, the sector contributed close to 12% of GDP in 2017. While this is relatively small (the Community, Social & Personal services sector contributes 21% and the financial and business services sector 18%), its business cycle influence resides in the fact that more than 50% of inputs are sourced from other sectors in the economy, such as mining (15% of intermediate inputs), retail, wholesale & accommodation (11%), agriculture (7.4%), etc. – see the diagram. This implies that the sector influences broad economic activity in a strong way. The length of value chains often results in mismatches between final demand in the economy and the supply of raw materials. This gives effect to cyclical patterns in the evolution of the sector’s growth – see the chart below, with the shaded areas indicating the downturns in the sector over the period 1970 to 2019.
The manufacturing cycle
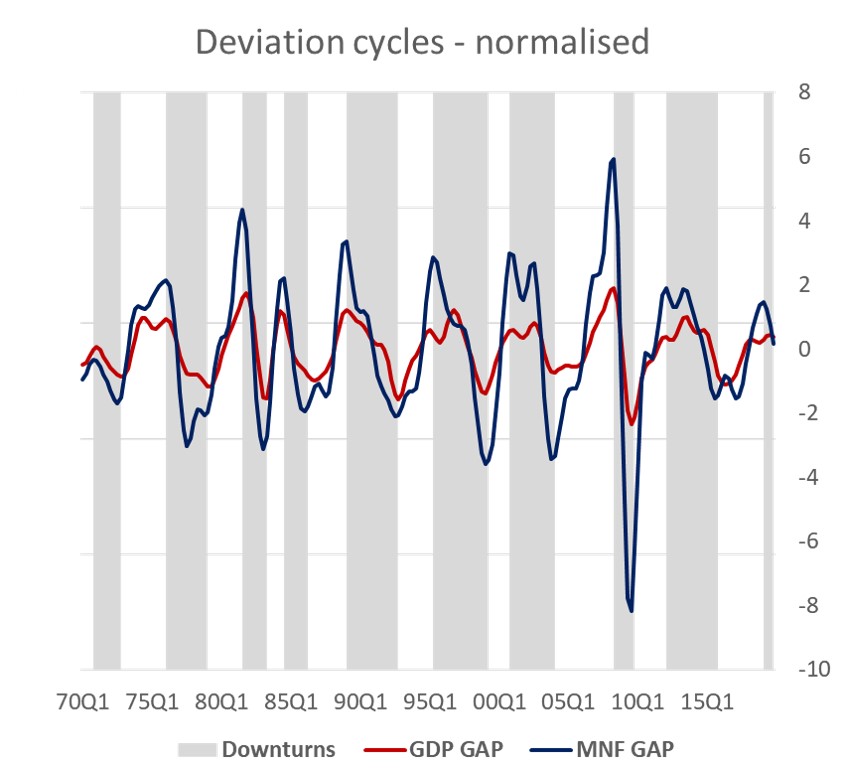
The interesting part of the manufacturing cycle is that it corresponds closely to that of the broader economy, albeit evident that the sector is more volatile. Whereas the variation in GDP moves between two standard deviations, that of manufacturing moves between 3-4 standard deviations, with an extreme of six during the Great Recession (2008-09). This close correspondence and higher volatility are depicted in the accompanying chart. Manufacturing real output is also part of the SARB’s coincident economic indicator due to its contemporaneous relationship with changes in GDP.
In the chart (below right), the blue shaded areas indicate SA’s official business cycle phases (as determined by the SARB on a regular basis) and compare it to the manufacturing cycle (light red shaded areas). The latter was derived by using the Bry-Boschan Quarterly (BBQ) method of determining successive periods of expansion and contraction in manufacturing real value-added, after the latter was de-trended and the resulting cyclical component transformed to its natural logarithm.
It is evident that there is a close correspondence. A cross-correlation analysis over the 1970-2019 period finds an 89% contemporaneous correlation with GDP over this period; in fact when a one quarter lag in GDP is considered (i.e. a one quarter lead in manufacturing activity), the correlation coefficient remains at 89% (one quarter lag, 76%)[1]. This suggests the manufacturing sector value added has a leading-to-contemporaneous relationship with GDP. It should be noted that the aggregate sector consists of a range of sub-sectors.
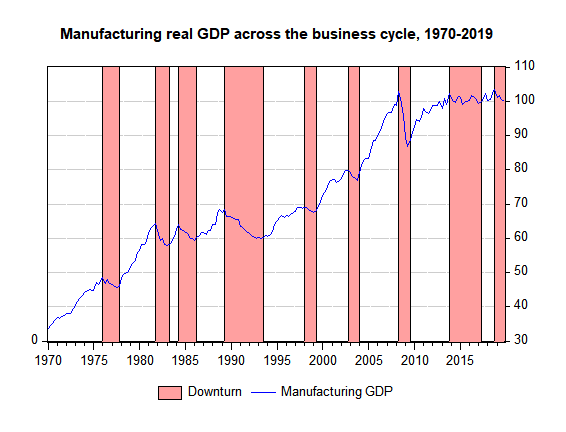

Only one downturn in manufacturing, i.e. between the end of 2002 and the end of 2003, did not result in an official economic downturn. In fact, this turning point determination has been criticized in subsequently revised economic data. An analysis of the peaks and troughs shows that the manufacturing sector coincides with general upper turning points on average, whilst it tends to lead to lower turning points, i.e. the onset of broader economic expansion by one quarter (see table).

In all, the manufacturing sector plays a critical role in the shape of the SA business cycle. Whereas the sector’s direct nominal contribution to overall GDP has shrunk to 11.8% in 2021, it should be remembered for each rand worth of GDP generated, the quantum of actual economic activity multiplies by a factor of four – the output/GDP ratio of the sector is 3.96.
Manufacturing firms supported more than one trillion rands worth of demand from other sectors in the economy in 2017 in order to generate value-added in the order of R551 billion. In output terms, the sector accounts for more than one-fifth of general economic activity in SA.
Manufacturing sub-groups and recent developments
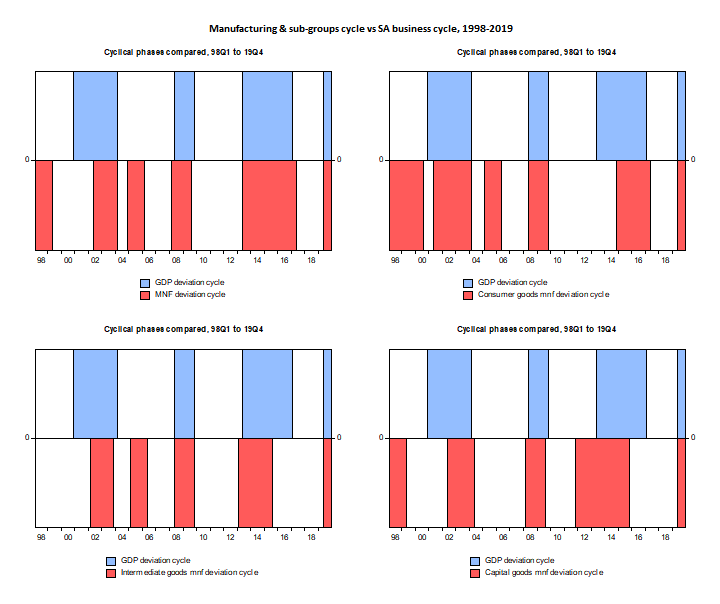
The foregoing analysis of manufacturing real value-added (of GDP) is corroborated with a similar analysis of real manufacturing output, also when the latter is disaggregated into consumer goods, intermediate goods and capital goods manufacturing output. The first chart below shows the good correlation between the aggregate manufacturing sector output cycle (1998-2019) and its three major groups with the national business cycle (as represented by the GDP deviation cycle). Manufacturing and its major subsectors’ cycles tend to coincide with the national business cycle. Not one of the groups/ subsectors leads or lags the national business cycle by more than 3 months. The correlation coefficient of aggregate manufacturing sector real output cycle component and that of national GDP is 0.88.

At a quarterly frequency, the consumer and intermediate goods manufacturing cycle coincides with the national business cycle – the respective correlations are 0.77 and 0.76. Contrary to the consumer and intermediate goods sectors, the capital goods sector tends to lead the national business cycle by one quarter – the correlation with GDP (lead one quarter) is 0.89. This is somewhat counter-intuitive and may be the result of including the automotive manufacturing sector as part of the capital goods sector. Vehicle sales is a known leading indicator of economic activity.
Recent developments. The SA economy rebounded strongly during the second half of 2020 from the second quarter COVID-19-induced slump (16.6% quarter-on-quarter). Before the pandemic impact, the economy was in a classic recession from the third quarter of 2019; however, the downturn commenced at the end of 2013 when the growth momentum dipped below its trend rate. Years of below-trend growth and then heavy contraction has left the economy in a parlous state. Business and consumer confidence are currently recovering from extremely weak levels. High unemployment is also weighing on the consumer sector and the broader recovery pattern is hesitant rather than smooth.
Regarding the manufacturing sector, the rate of de-industrialisation in SA intensified dramatically over the period since late 2013 when the economy entered its latest downturn. The plunge in manufacturing GDP/output was also precipitous (29.1% and 28.6% quarter-on-quarter) owing to the lockdown-induced contraction during 2020Q2. This surely represents a historic low for the sector. The somewhat unanticipated aspect has been the rebound in GDP during the second half of 2020 (33% and 5% during Q3 and Q4 respectively), helped along by renewed demand from abroad and a weak exchange rate. The latter, including the plunge in the domestic market, presumably also stimulated import replacement. This rebound disappointed again during the first quarter of 2021 in the face of renewed lockdown measures (and the returning strength of the rand exchange rate). Nonetheless, the level of overall manufacturing GDP was only 0.7% below that of a year earlier, i.e. before the impact of the pandemic; output volumes was slightly above year-ago levels.
Owing to the relative resilience of consumer demand, which contracted less (6.4%) compared to other GDP components, the output of consumer goods manufacturers also contracted the least, i.e. by 21.2% and recovered to levels 1.1% above those a year earlier during 21Q1. Intermediate goods production contracted by 25.6% and recovered the slowest, being still 5.2% below pre-crisis levels during 21Q1. Capital goods output responded sharpest to the lockdown measured and associated economic contraction and plunge in business confidence, contracting by 45.1% (quarter-on-quarter) during 20Q2. It rebounded sharply during 20Q3 (by 66.8%) and ended 21Q1 6.6% above levels a year earlier. Dwindling intermediate output and sharply lower growth in consumer and capital goods output explain the disappointing recovery in overall manufacturing output during the first quarter of 2021. The contraction and rebound of output levels during the pandemic impact were similar in terms of timing across the major manufacturing groups and subsectors.
References
McCarthy, C.L. 2015: “South African Trade Policy: What can it achieve given supply-side stumbling blocks”, Stellenbosch, tralac
Simandan, D. 2009: “Industrialization”, in R Kitchin & N Thrift, Eds., International Encyclopedia of Human Geography, Oxford: Elsevier, 5: 419-425
[1] The manufacturing real value-added time series (including a natural log transformation) was de-trended using a Christiano-Fitzgerald (CF) band-pass filter and the analysis was conducted with the same in SA’s GDP. This is on the assumption that the successive periods of expansion and contraction in GDP are representative of the SA business cycle, indeed what has been proved in research (see Du Plessis, 2006).