
From the end of 2016 and early 2017 it became clearer that the world economy was picking up nicely. Whilst 17Q1 witnessed some (temporary) slowing in the US, Euro area and Japanese growth surprised on the upside. China’s growth also continued close to 7% and the remainder of the emerging market universe recovered from the 2015-16 commodity-price induced slowdown.
The inflection point of this global recovery was mid-2016 – witness Goldman Sachs’ global Current Activity Indicator (CAI) correlated in the chart with global GDP growth (chart below). This was a pivotal change in the global economic performance in the post-2009 period. Whereas forecasters previously tended to overestimate the actual performance of the world economy, Goldman Sachs points out that this pattern was reversing: actual growth in the world economy began outperforming the forecasts by 17Q3 (Goldman Sachs: As good as it gets, 15 November 2017).
The world economy appeared to have crossed an important threshold in the post-2009 recovery period: a positive business cycle dynamic was unfolding – fixed asset investment was responding to higher levels of consumer spending, both being driven by higher confidence. This positive feedback loop was largely absent over the 2010-2015 period. Monetary policies remained stimulatory in the major advanced economies and scope opened up to ease fiscal restraint. Renewed growth became broad-based, most countries being lifted by the same tide. The improvement in economic growth in the advanced economies also spilled over to the emerging economies. JP Morgan points out that by 17Q3, no less than 75% of the countries they tracked were registering above-trend GDP growth; 80% of the PMI’s of 27 countries reached levels above their 2010-to-date averages; and around 60% of the countries’ retail sales growth was above their 2010-to-date average (JPM Global Data Watch, 13 October 2017).

Renewed global growth was therefore broad-based, not only across sectors, but also across world regions. Some other encouraging characteristics of this global business cycle expansion include the fact that many countries were closing their negative output gaps and – more importantly – showing signs of improved productivity growth. The overall impression is that this growth revival has enough fuel to be sustained during both 2018 and 2019. The IMF recently upgraded its forecast for global growth to 3.9% during both 2018 and 2019, up from 3.8% in 2017, i.e. the fastest growth since 2011. Following years of economic under performance, characterized by poor business confidence and investment, particularly over the period from mid-2011 to mid-2016, this self-sustaining global business cycle dynamic is very encouraging, yet it unfortunately needs to be qualified.
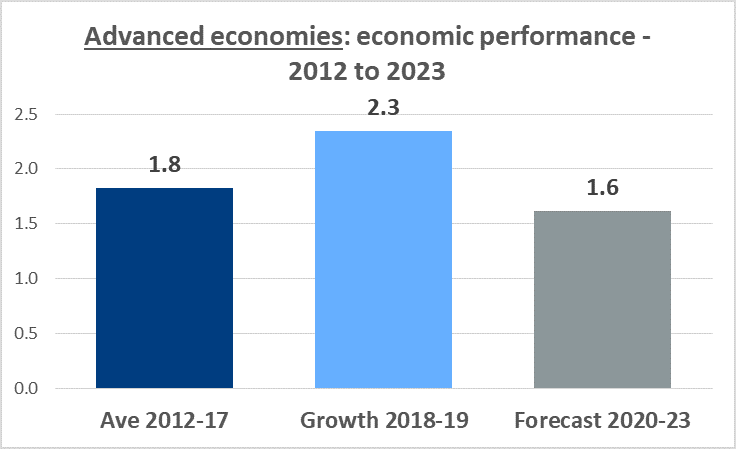
Some perspective. There are two dimensions of the growth improvement that need to be highlighted. Firstly, the close to 4% average projected annual growth is still well below the robust growth registered over the 2004-07 period (i.e. 5.3% per annum); and, secondly, the outlook beyond 2019 is much more uncertain and may repeat the growth outcome in the five years preceding the current revival, i.e. over the period 2012-17 (first chart below). It is therefore important to realise that the level of growth is unlikely to accelerate to pre-recession levels any time soon. There is already evidence that global growth is plateauing. Evidence emerged early-2018 that particularly in the Euro area (across regions) and industrial production (across sectors) the growth momentum receded somewhat, best reflected in moderating PMI readings. Short-term expectations were also negatively impacted by the unexpected rise in the crude oil price, briefly exceeding the $80/b level in April/May (following the US’ withdrawal from the Iranian nuclear deal) and the devastating impact of trade restrictions entering the fray, as well as a mini political crisis in Italy with a new government which may want to exit the EU. Uncertainty pertaining to the Korean peninsula is another headwind. Then there is the current rise in inflation, specifically in the USA in the context of a tightening labour market. Are we heading towards excessive inflation in the USA (or elsewhere)? A closer look to the inflation equation provides additional perspective.
The inflation bogeyman. US core inflation has risen to target levels (2%) and whilst it remains subdued in the Euro area and Japan (around 0.7%), the fear is that inflation pressures could accumulate, forcing the Fed’s (and the other central banks’) hand. Historically, this is typically the trigger of recession. To be true, the way the Fed approaches the inflation bogey will impact the US business cycle, with its usual spillover effects on the rest of the world. While inflation is on the rise, particularly in the US economy leading the revival of economic growth amongst the advanced economies and in the wake of the Great Recession, we are less concerned regarding inflation over the short to medium term. On the one hand, its management is likely to cap US economic growth; on the other, if approached in an appropriate manner, will ensure the sustainability of growth even if at somewhat lower levels compared to the current sweet spot in the business cycle.
Why should we be relaxed about US inflation in the context of an array of inflation pressures (e.g. a tight labour market, potentially overheating fiscal stimulus, cost-raising import tariffs, the high oil price and the closing of the negative output gap)? In answering this question, we need to revisit the famous economic identity, i.e. the equation of exchange: MV = PT, where M refers to the money supply; V to the velocity of money; P to the general price level and T to the number of transactions in the economy (i.e. equivalent to the real GDP).
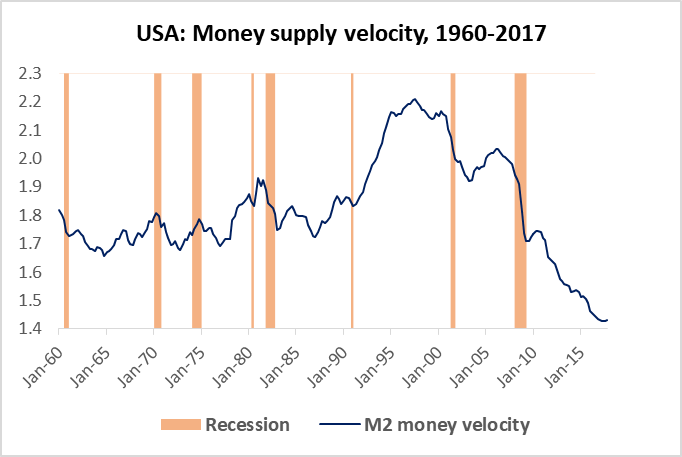
US monetary policy is currently closely tuned towards containing the increase in inflation: self-sustaining economic growth affords the Fed the opportunity of re-balancing its balance sheet (i.e. reversing QE and restraining money supply growth, i.e. M in the equation above). More importantly, the velocity of the broad money supply (V) remains at historical lows – see the chart above. In combination, these two factors should ensure non-inflationary growth, which follows directly from the equation of exchange.
Chances that money velocity increases sharply are remote: it is a function of two important forces: firstly, the degree to which individuals and businesses are willing to commit to debt (i.e. leverage); and, secondly, financial innovation. The former has picked up following years of deleverage; however, given the high debt levels, it is unlikely that these deleverage forces have expended themselves. Secondly, financial innovation is to an important extent suppressed by the regulatory reforms in the wake of the US sub-prime financial crisis (Basel III). Until money velocity picks up more meaningfully, inflation concerns are likely to be exaggerated. It is going to take years before the US specifically and the advanced economies in general move beyond these underlying forces keeping inflation in check and ensuring non-inflationary growth.
Finally, cost-push factors are also unlikely to cause undue inflation. The current oil price pressures are likely to recede as Russia and OPEC agree to lift output and shale oil supply increases. Furthermore, wage pressures are not expected to lead to cost-push inflation. Wage growth is expected to occur at the expense of profit growth as the bigger structural change involves efforts to address the high level of income inequality. Rather than pushing up prices, the increase in wage levels is likely to be accompanied by a shift in the wage share of GDP.
The implication is that the gradual process of interest rate normalization in the US (and other major advanced economies, for similar reasons) is likely to continue. We therefore do not anticipate an abrupt end to the current favourable US (and global) business cycle dynamic. While the implied sustainability of non-inflationary growth is encouraging, it remains important to return to the perspective outlined above: there are other concerns and longer term trends that need to be taken into consideration when contemplating the medium-term future for global growth.
Medium-term concerns and longer term trends. The picture that emerges, is as depicted in the chart above. In line with the latest IMF forecast for world economic growth, the favourable short-term dynamics (2018-19) in the advanced countries of the world are likely to be followed by a return to more moderate economic growth rates. The real GDP growth of these countries are projected to average 1.6% per annum during the outer years of the forecast period, i.e. 2020-23. This will be down from 2.3% per annum forecast in respect of 2018-19 (and even the average over the 2012-17 period). While the near term recessionary risk of a sharper spike in the oil price is real, such a scenario is not factored into the IMF forecast. As alluded to above, the likelihood is for the recent oil price increases to settle down and even reverse. The more serious medium-term concerns relate to the two biggest economies in the world, i.e. the USA and China.
The fact of the matter is that the US economic expansion will be approaching 10 years next year, which is long in a historical context. As noted, the near-term business cycle dynamics are healthy and prospects for non-inflationary growth are good. However, it is worthwhile to note the risk of excessive fiscal stimulus (read: corporate tax cuts and infrastructure investment on-top of lively demand conditions) and miss-timed monetary tightening. While, the shape of the anticipated US slowdown will depend on how these developments unfold, one has to factor in some negative impact on global growth from US sources over the period beyond 2019.
Then there is the China factor. The economy remains on a steep growth curve even as the average growth rate has receded from double-digit levels (2000-11) to 6-7% per annum. As alluded to previously, an increasing share of China’s growth has become dependent on debt accumulation (Pettis, June 2016). China is currently estimated to own 37% of world non-financial sector debt. This is up from 17% owned by Japan at the peak of its long-term expansion during the late 1980s. It is also higher than that of the USA (30%) at the onset of the sub-prime financial crisis in 2007, or that of Euroland (24%) at the time of its sovereign debt crisis (2010) (see Raubenheimer, May 2018). More worrying is the fact that China’s share of outstanding non-financial sector debt has exploded from below 15% in 2009 to 37% currently. Clearly such a debt trajectory is unsustainable. The sustainability of Chinese economic growth is dependent on the new political leadership being successful in effecting a dramatic shift of wealth and income to address inequality in the economy (see Pettis, April 2018). How this process of re-balancing will play out is not clear to see, except to assume that the country’s high economic growth is likely to recede over the medium-term.
Apart from these concerns regarding the two biggest economies in the world, there are other medium- to longer term trends, which will make it unlikely that – at least the advanced economies of the world – will surpass the rates of economic growth achieved before the Great Recession impact. First, there is the reality of climate change and the depletion of the world’s natural resources. Secondly, population dynamics in large economies such as Europe, China and Japan are already constraining potential GDP growth rates. Thirdly, we may be witnessing the tail-end of the computer revolution, i.e. a factor that has been considered as an explanation for the tapering of productivity growth trends in the major advanced economies (see CHEC, 2012).
While the fourth industrial revolution, the impact of social media and Big Data is upon us, the productivity spin-offs of these major technological revolutions have a long gestation period. Everything considered, it is expected that the trend growth rates of the advanced economies have tapered for the foreseeable future. This does not necessarily apply to the emerging market economies, with rapidly growing middle class populations. However, the emerging market economies will be impacted by lower growth in the advanced economies and are also subject to the natural limits to growth. The IMF forecast suggests that emerging economies will continue to catch-up over the medium-term, but its projected growth is 5% per annum, very much in line with that over the 2012-17 period (4.8%) and down from the 6.2% per annum achieved over the 2000-11 period.
In all, while one can take heart from the current favourable business cycle dynamics, which should ensure lively world economic growth over the short term (2018-19), the acceleration of growth since mid-2016 has probably peaked. This is below levels typically witnessed is previous business cycles. Furthermore, the outlook in respect of the outer years (2020 and beyond) appears to be less rosy and more uncertain. The likelihood is that the world economy may be adjusting to more sustainable and lower real economic growth rates in the 21st century.
References:
1. CHEC (May 2012): OneCape 2040 vision, online: https://www.westerncape.gov.za/sites/www.westerncape.gov.za/files/one-cape-2040-narrative-4th-draft-19-october-2012_0.pdf
2. Goldman Sachs (15 November 2017): As Good as it Gets, Global Economics Analyst.
3. JP Morgan (13 October 2017): Global Data Watch, Economic Research.
4. Pettis, M (22 June 2016): Rebalancing, wealth transfers, and the growth of Chinese debt, online: http://blog.mpettis.com/2016/06/rebalancing-wealth-transfers-and-the-growth-of-chinese-debt/
5. Pettis, M (3 April 2018): High Wages Versus High Savings in a Globalized World, online: http://blog.mpettis.com/2018/04/high-wages-versus-high-savings-in-a-globalized-world/
6. Raubenheimer, S (May 2018): Allan Gray Investment Update, online: https://www.allangrayevents.co.za/IS18/downloads/cpt/Allan-Gray-Investment-Update.pdf